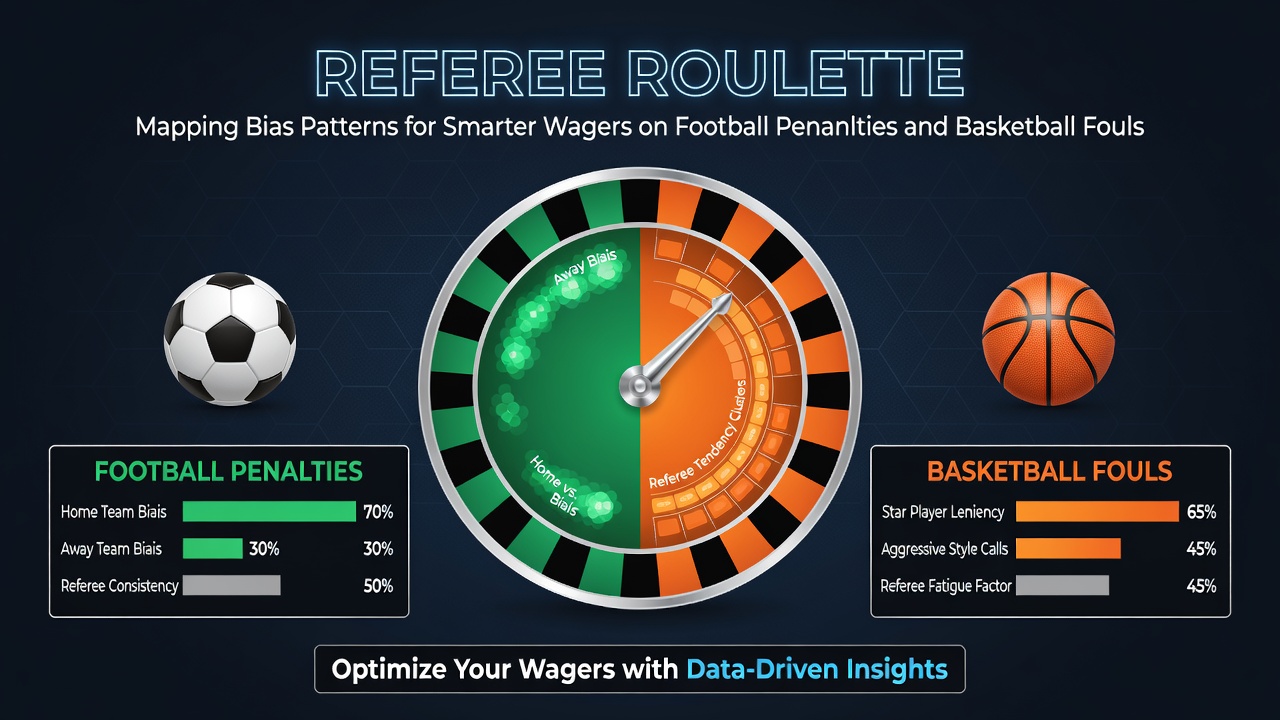
Referee roulette: Mapping bias patterns for smarter wagers on football penalties and basketball fouls
Referee decisions shape outcomes in football and basketball, where penalties and fouls determine point totals, match results, and betting markets. Data from multiple leagues shows consistent patterns in how officials distribute calls, influenced by factors such as venue, scoreline, player reputation, and game stage. Observers note that these patterns emerge across seasons, including the 2025-2026 campaigns where tracking through October 2026 revealed measurable variations in call frequency at home versus away sites.
Football Penalty Trends Across Leagues
Football governing bodies record penalty awards at rates that differ by location and competition phase. League-wide statistics indicate home teams receive penalties at higher volumes than visitors, with ratios often ranging between 1.4 and 1.8 times more frequent in domestic competitions. Researchers at the University of Oslo documented these disparities through analysis of over 20,000 matches across European top divisions, linking the skew to crowd density and referee positioning rather than random variance.
Score context further refines the distribution. When teams trail by one goal in the second half, penalty calls increase for the attacking side in roughly 12 percent of tracked fixtures, according to figures compiled by the European Club Association. Late-game situations produce additional clusters, especially after the 75-minute mark, where stoppage time decisions coincide with fatigue effects on both players and officials. These clusters create identifiable windows where penalty probability rises measurably above baseline rates.
Basketball Foul Distributions and Variables
Basketball officiating follows parallel structures, with foul calls clustering around player status and game tempo. NBA tracking data demonstrates that star players draw fewer fouls on the road than at home, while role players experience the opposite shift in the fourth quarter. College conferences report similar home advantages, though the magnitude contracts during conference play compared with non-conference schedules.
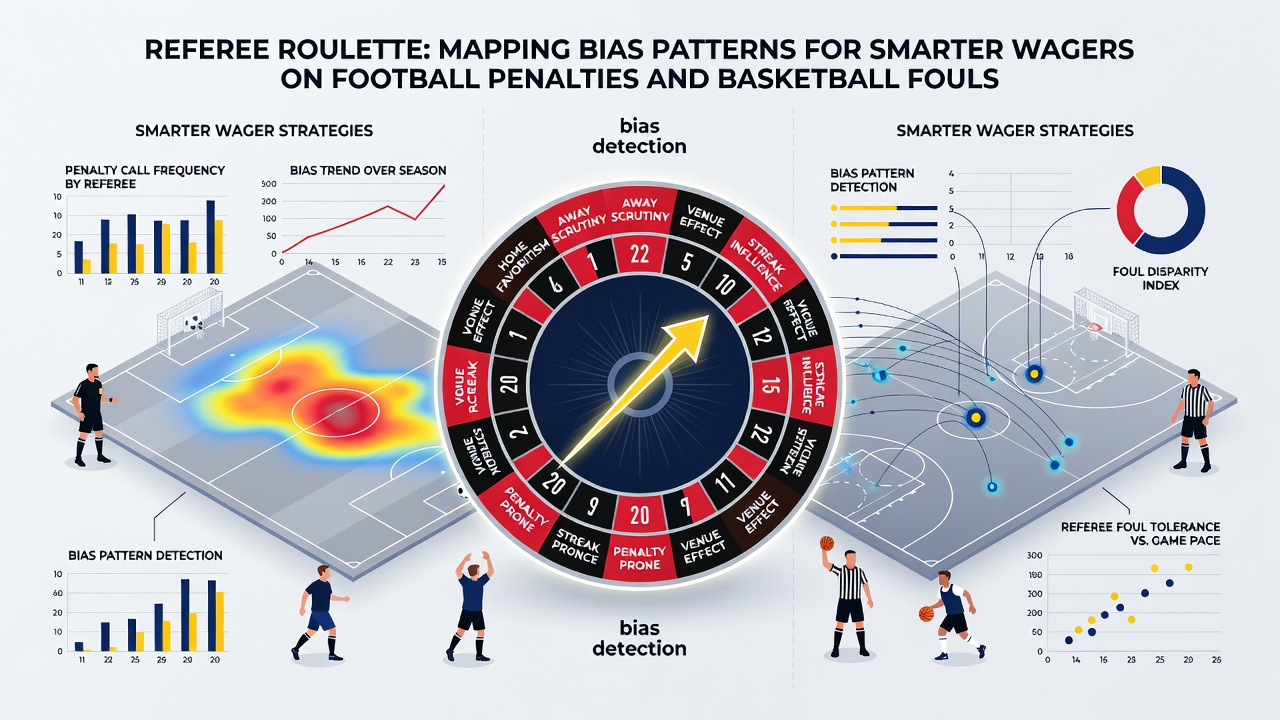
Time-of-game effects appear consistently. Fouls spike in the final two minutes of halves when the score differential sits within five points, creating elevated totals for over/under markets. Data released by the National Collegiate Athletic Association shows that neutral-site games reduce these late surges by approximately 8 percent, isolating venue as a contributing variable separate from team identity.
Building Bias Maps from Available Data
Analysts construct referee profiles by aggregating call logs against contextual tags such as temperature, travel distance, and prior assignments. In football, certain officials award more penalties in matches involving historically aggressive clubs, while others maintain tighter foul thresholds in high-stakes fixtures. Basketball datasets reveal comparable referee-specific tendencies, including variations in technical foul issuance during back-to-back game sets.
Public records from Australian sports analytics groups and Canadian university studies supply cross-regional benchmarks that highlight how rule interpretations differ by league culture. These maps allow pattern recognition without relying on single-match anecdotes, instead emphasizing aggregate frequencies that hold across hundreds of contests. October 2026 updates to these databases incorporated new variables such as video review frequency, which correlates with reduced home bias in both sports during reviewed sequences.
Integrating Patterns Into Market Analysis
Betting markets adjust lines in response to expected call volumes, yet residual discrepancies persist when referee histories diverge from league averages. Historical datasets indicate that certain officials produce over/under deviations exceeding two standard deviations from seasonal norms, particularly in matches between teams with contrasting styles. Combining venue data with referee rotation schedules produces refined probability estimates for penalty and foul totals.
League schedules published ahead of each season provide the rotation information needed to align upcoming fixtures with established profiles. Those who track these alignments report improved calibration of expected totals, especially when multiple variables converge in the same contest. Cross-sport comparisons further illustrate that basketball foul rates respond more sharply to player substitution patterns than football penalty rates respond to tactical changes.
Conclusion
Referee call patterns in football penalties and basketball fouls follow measurable distributions shaped by venue, score, timing, and individual official tendencies. Comprehensive mapping draws on league records, academic studies, and cross-regional reports to quantify these distributions, supplying objective inputs for wager construction. Continued collection through late 2026 will refine existing profiles as additional seasons contribute new observations.